Reducing contracted power: how an ESS cuts fixed energy costs
Contracted power reduction with an ESS lowers demand charges and fixed energy costs. Learn DSO conditions and prepare data—then calculate your scenario.
Contracted power reduction: how an ESS cuts fixed energy costs
Contracted power reduction is one of the most reliable ways an energy storage system (ESS/BESS) can cut fixed energy costs—by keeping your site’s grid import below a set limit so you can contract a lower capacity (and pay lower monthly fixed charges). This article is for CFOs, facility managers, and energy procurement managers who want predictable savings without rebuilding their whole electrical infrastructure. You’ll learn how the mechanism works, what DSOs typically require, what data you need for analysis, and how to estimate the impact quickly.
Many companies try to reduce energy bills by negotiating energy prices alone. But for facilities with demand charges / peak demand charges, the biggest savings often come from managing power (kW), not just energy (kWh). That’s exactly what peak shaving with battery storage is built for.
Table of Contents
- What is contracted power reduction?
- How does an ESS reduce contracted power and demand charges?
- DSO conditions and practical constraints
- What data do you need to calculate ROI?
- Examples and scenarios: what savings can look like
- ROI and savings: the CFO view
- How to get started (without a long internal project)
- FAQ (Frequently Asked Questions)
- Summary
- Next steps
- Sources and References
What is contracted power reduction?
Contracted power (sometimes called contracted capacity) is the maximum power level you agree with your utility/DSO that your site will draw from the grid. In many tariff structures, your monthly bill includes a fixed component tied to that contracted level—and/or demand charges based on your measured peak demand.
Contracted power reduction means lowering that contracted kW (or kVA) level without disrupting operations by ensuring your facility rarely (ideally never) exceeds the new limit.
In practice, it’s a financial strategy that uses operational control:
- reduce or cap grid import during peaks,
- avoid crossing thresholds that trigger higher fixed fees or penalties,
- stabilize monthly costs for budgeting.
Energy storage is a particularly effective tool because it can supply power instantly when your load spikes, keeping grid import under the contract limit—exactly the “peak demand reduction” mechanism used in many programs globally (CESA).
How does an ESS reduce contracted power and demand charges?
An ESS for contracted power works through peak shaving: it discharges during short periods when your facility load would otherwise exceed a target limit.
The simple control logic (non-technical)
You set a target grid import limit, for example:
- Contracted power today: 800 kW
- Proposed contracted power: 650 kW
- Target import cap: 650 kW
When your site load rises to 720 kW, the battery discharges ~70 kW so that the grid sees ~650 kW.
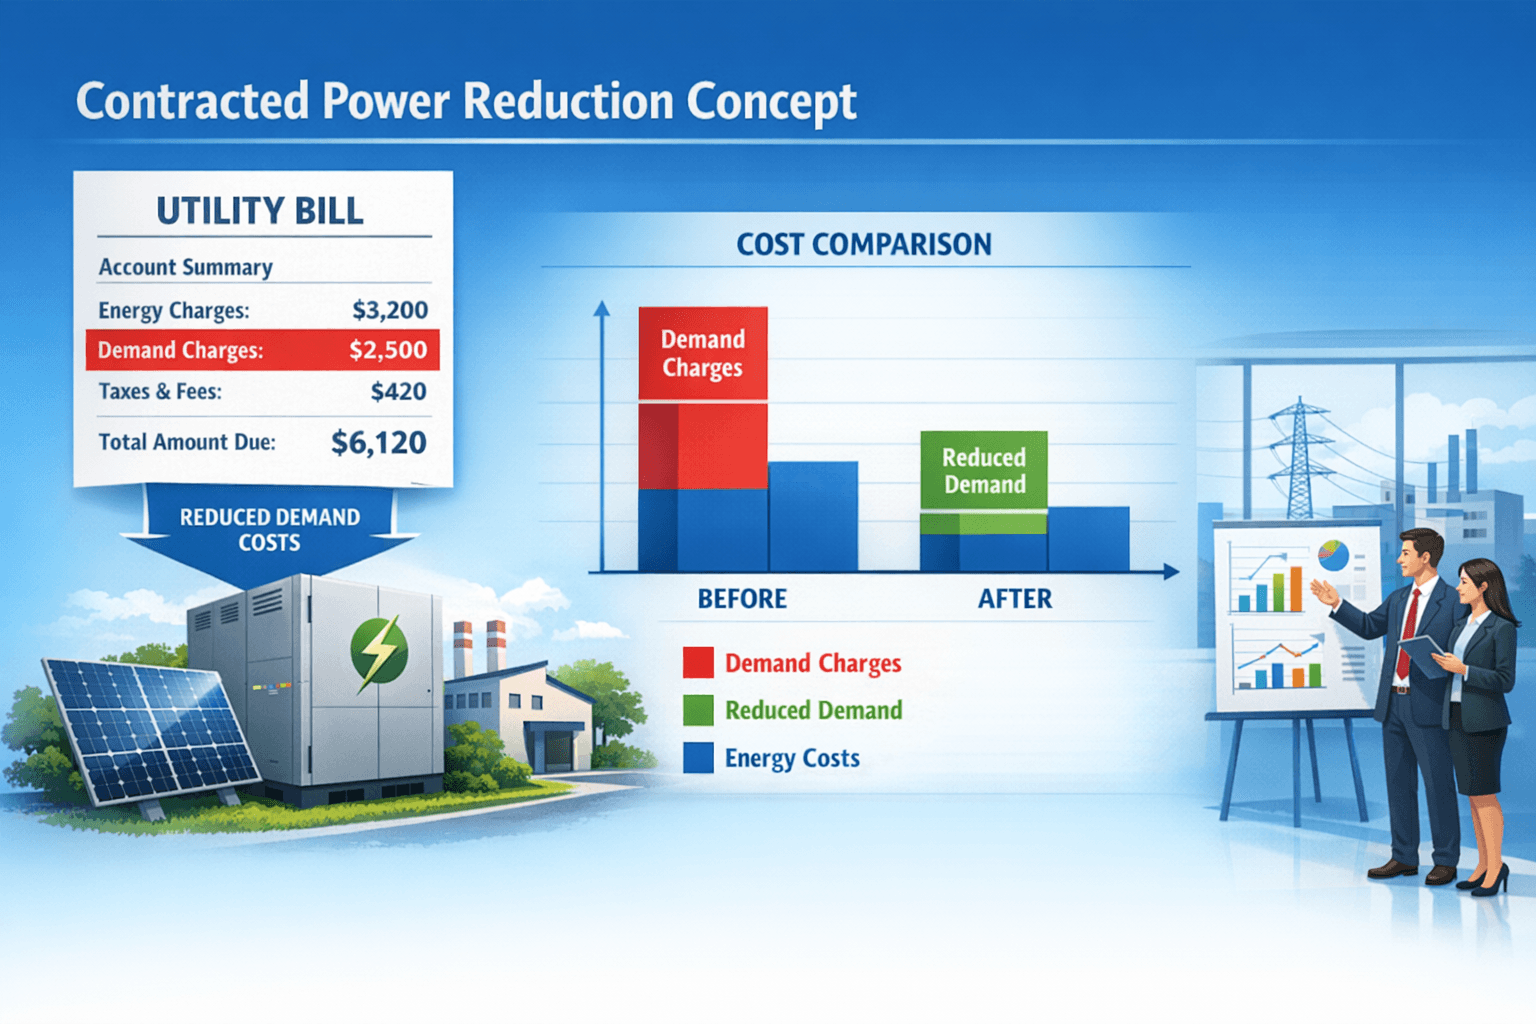
Why this reduces fixed costs
Many commercial tariffs include:
- capacity-related fixed charges, and/or
- peak demand charges based on the highest measured interval (often 15-minute or hourly).
Reducing the contracted level and controlling peak import reduces those charges. Programs and commercial models designed around peak demand reduction explicitly use storage dispatch to lower peak demand exposure (CESA).
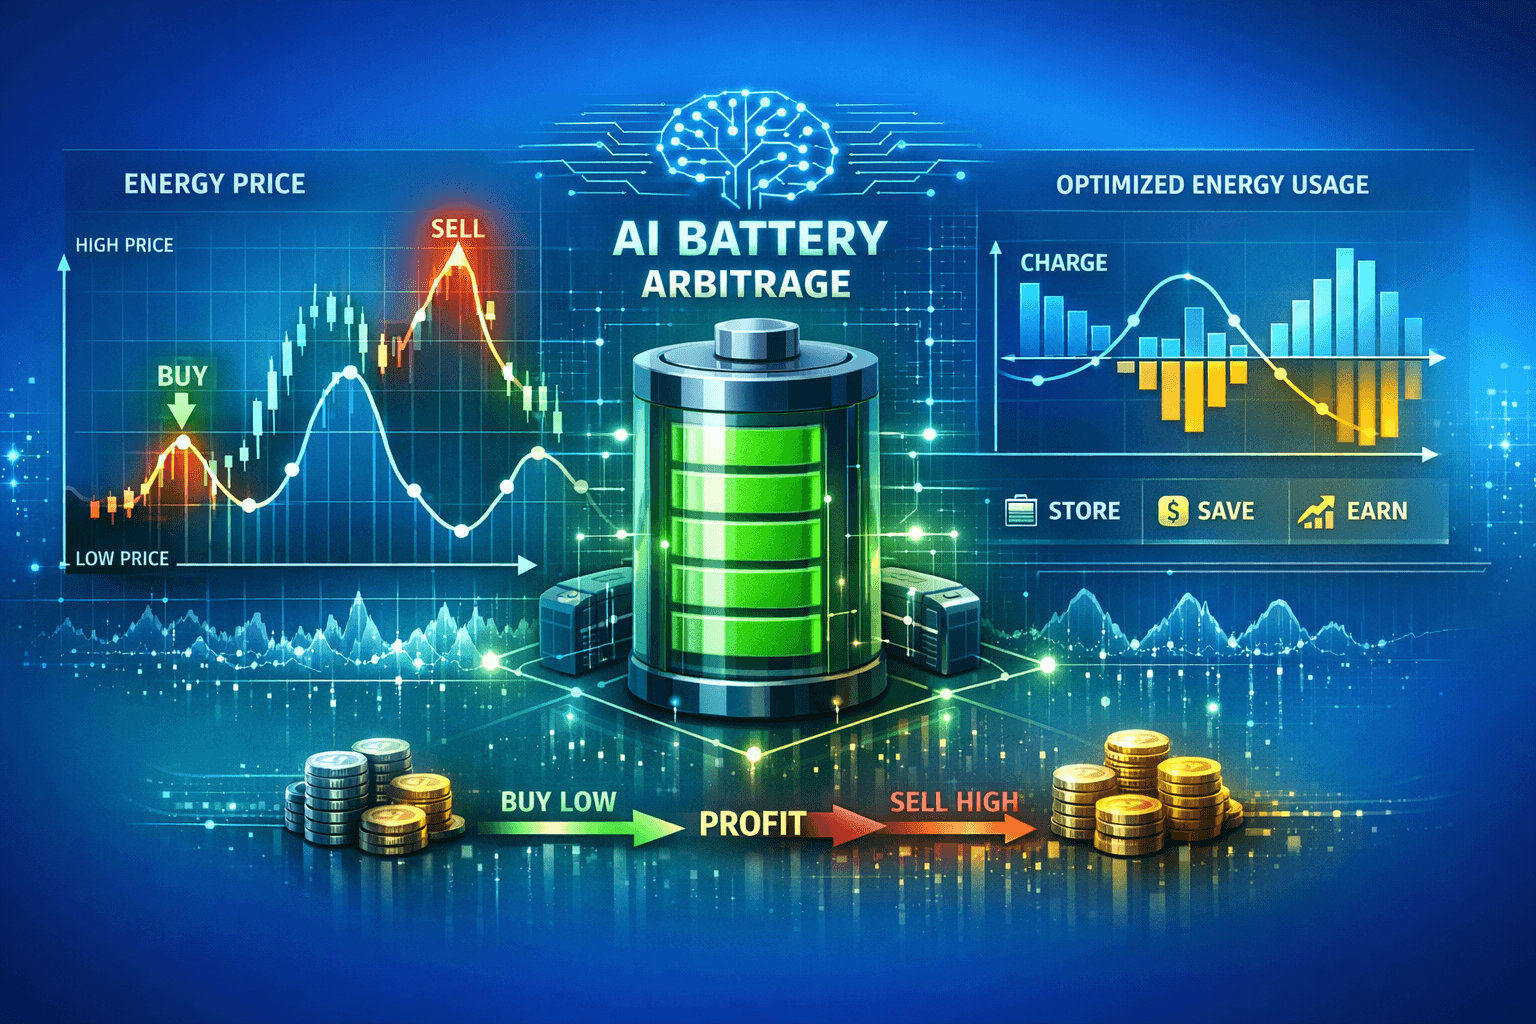
Peak shaving + arbitrage (often both)
Peak shaving is the core for demand charges. But a battery can also do energy arbitrage:
- charge when energy prices are low,
- discharge when prices are high.
This matters because it can fund part of the battery operation while still respecting your demand cap. The general “charge cheap, discharge expensive” value proposition is widely documented (Convergent, EPA).
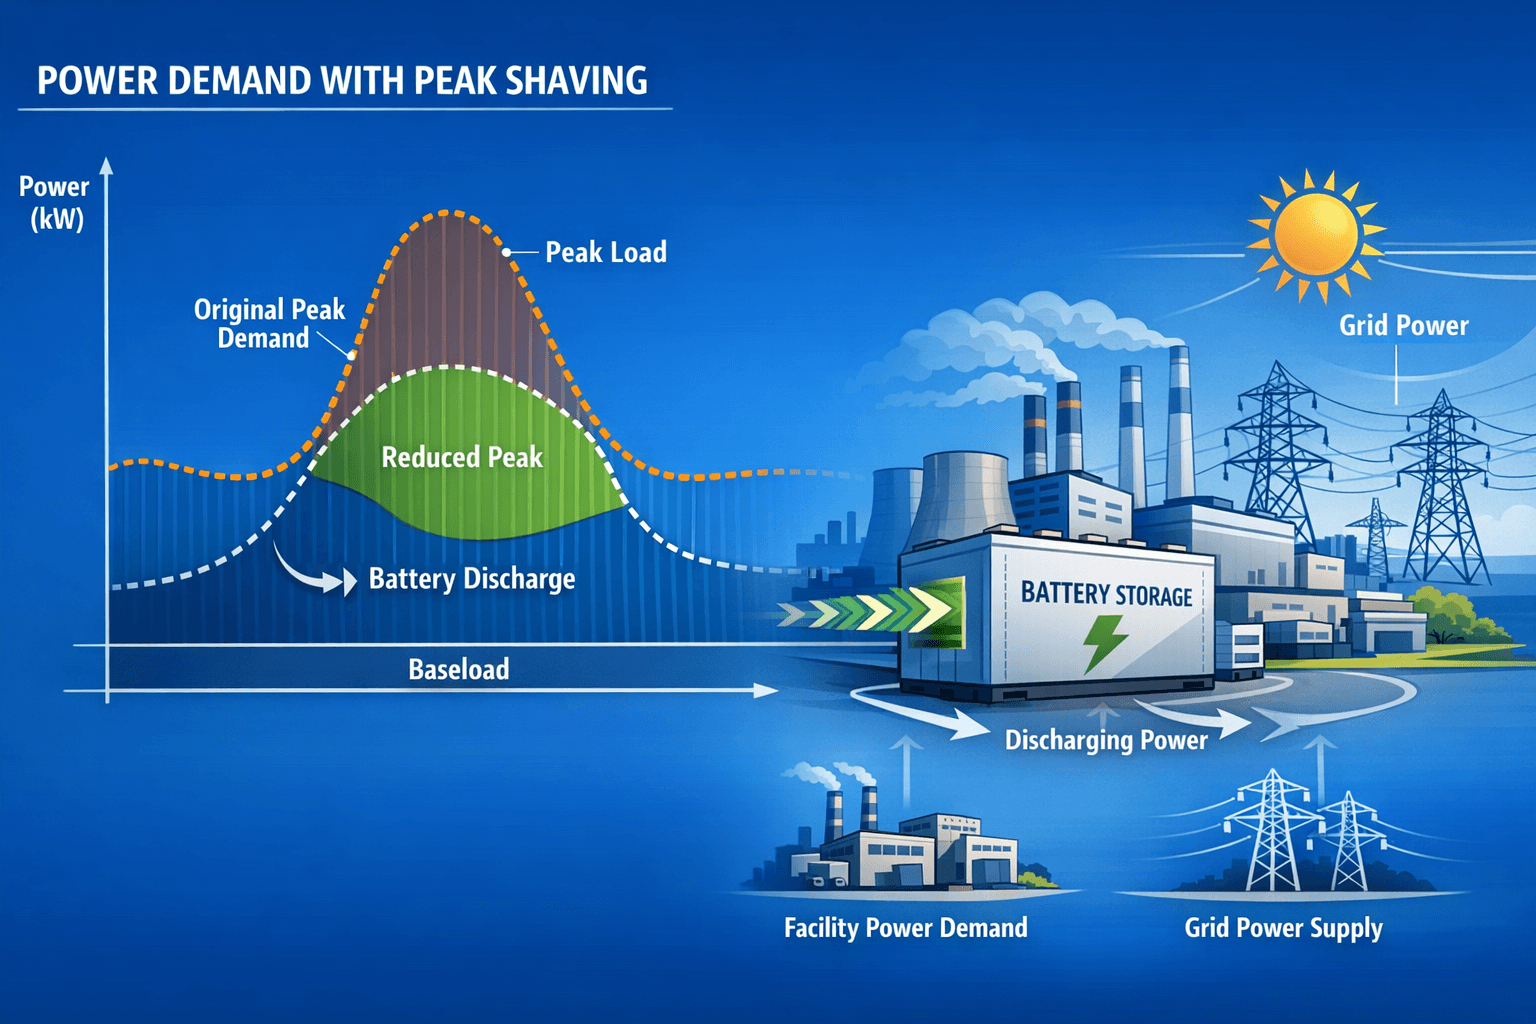
A quick diagram (conceptual)
Below is a simplified illustration of what the meter “sees”:
- Without ESS: grid import follows facility load (peaks included)
- With ESS: battery covers the top of the peaks, grid import stays capped
Result: lower measured peak demand and a realistic path to contracted power reduction.
What about efficiency?
Batteries are not “free energy.” They lose some energy in the charge/discharge process. That’s captured by round-trip efficiency (RTE)—often around 80–85% for lithium-ion in real projects, depending on conditions and operation. This directly affects the net savings from arbitrage and should be included in any financial model (Edina).
Visual #1: Peak shaving sizing logic (rule-of-thumb table)
| What you’re trying to achieve | What matters most | Typical ESS sizing focus |
|---|---|---|
| Lower contracted power / demand charges | Peak size (kW) and peak duration (minutes) | Power rating (kW) + usable energy (kWh) to cover peaks |
| Reduce energy price exposure | Price volatility + operational flexibility | More kWh (duration) for shifting energy |
| Both at once | Peak management + price-aware dispatch | Balanced kW and kWh + smart control |
In many facilities, peaks are short. That’s good news: it often means you don’t need extremely long battery duration to materially reduce your peak.
DSO conditions and practical constraints
Contracted power reduction is not only a financial decision; it also touches grid connection rules and site infrastructure. DSOs (distribution system operators) typically focus on connection safety and predictability, not on your bill optimization.
1) Interconnection and permitting
Depending on your country and DSO, you may need:
- an interconnection application,
- protection settings and compliance checks,
- metering requirements,
- commissioning procedures.
Procurement and contracting guides emphasize that interconnection and permitting responsibilities must be clearly allocated (customer vs EPC vs developer) and that warranties/service terms matter for bankability (Morgan Lewis).
2) “Need” and operational constraints
Some grid programs (especially utility-led or incentive programs) require demonstrating a system purpose—such as peak demand reduction or grid support—and may specify dispatch windows or performance metrics (CESA).
Even without a formal program, your internal “need” should be explicit:
- What contracted power do you want to reach?
- How many peak events cause charges today?
- What operational risks are unacceptable (e.g., production stops)?
3) AC-coupled vs DC-coupled (in business terms)
You’ll hear these terms from installers. Here’s the CFO/facility-friendly translation:
- AC-coupled: battery system connects on the AC side. Often simpler to integrate into existing sites and PV systems, because it can be added without rebuilding the PV DC architecture.
- DC-coupled: battery and PV share more of the DC side. Can reduce conversion losses, but usually requires more architectural coordination.
Integration choices affect efficiency and project complexity (Edina)—which ultimately affects ROI and implementation time.
4) Contract structures: ownership vs contracted service
For many businesses, the key question is whether to:
- buy the ESS (CapEx), or
- contract it as a service (OpEx-like), e.g., a storage PPA/shared savings model.
Industry discussions highlight that “contracted” models can be capital-light (developer finances and takes performance risk), while ownership provides more upside but requires capital and operational responsibility (Utility Dive, Synertics).
Visual #2: Contracted power reduction — decision checklist
| Question | Why it matters | What to check |
|---|---|---|
| Is your bill driven by demand charges/fixed capacity fees? | This is where ESS value is strongest | Tariff + last 12 months invoices |
| Are peaks short and frequent? | Easier to shave with limited kWh | 15-min load profile |
| Can operations tolerate a strict import cap? | Avoid production risk | Critical loads and process constraints |
| Do you have space & electrical capacity? | Practical feasibility | Switchgear/transformer limits |
| Do you want CapEx or a service model? | Changes ROI and risk | Financing preference & accounting |
What data do you need to calculate ROI?
To accurately calculate energy storage savings, you need:
- Energy consumption profile (hourly or 15-minute intervals) or invoices + interval data
- Tariff / pricing model (fixed vs dynamic)
- Contracted power / peak demand information
- Existing PV installation details (kWp, production, self-consumption)
Examples and scenarios: what savings can look like
Below are simplified scenarios to show how savings are created. Your real result depends on tariff rules, interval length, and how your peaks behave.
Scenario A: “A few brutal peaks” (classic case)
- Facility runs steady at 450–550 kW
- Peaks to 750 kW for 10–20 minutes when equipment starts
- Contracted power today: 800 kW
ESS strategy
- Keep grid import capped at 650 kW
- Battery discharges 100 kW during those short peaks
Outcome
- Your measured peak can drop substantially
- You can negotiate/adjust contracted power closer to 650 kW
- Monthly fixed charges and/or demand charges decrease
This is the core “peak demand reduction” model described in storage program design (CESA).
Scenario B: “Peaks + volatile energy prices”
- Same facility, but energy price varies hour to hour
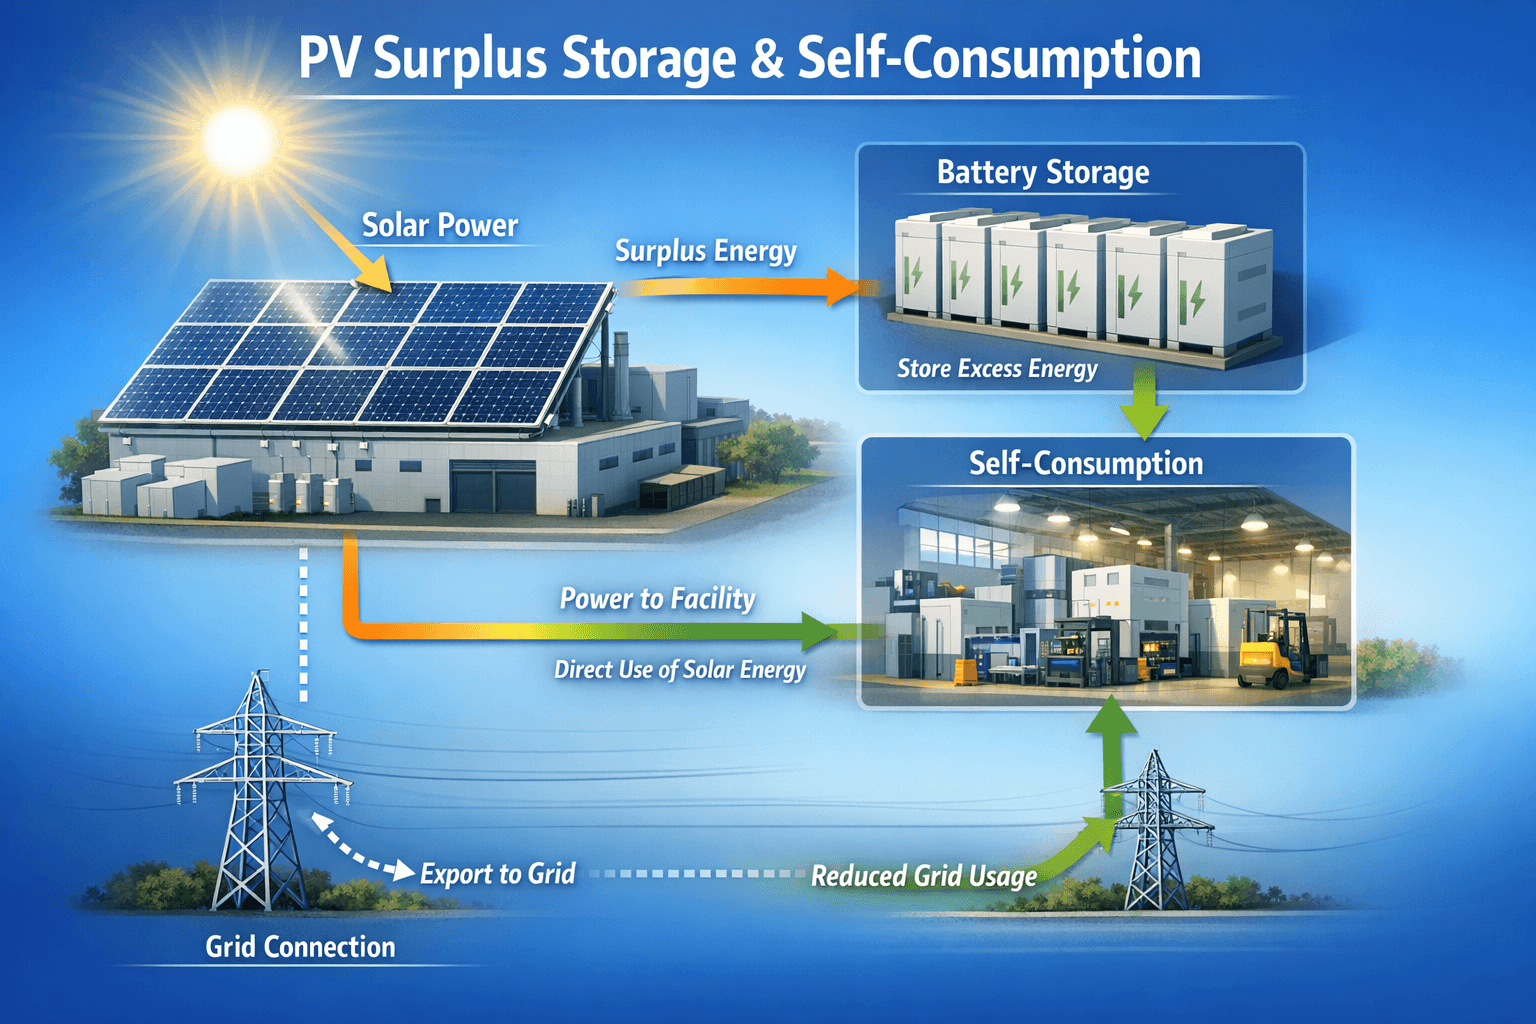
- You also have PV that sometimes exports while you still get peaks later
ESS strategy
- Charge at low-price hours or from PV surplus
- Discharge at peak price hours while maintaining the import cap
- Optimize with forecasting
Outcome
- Two stacked benefits: demand charge reduction + arbitrage value
- More stable energy procurement outcomes over the month
General guidance on arbitrage and balancing value of storage is widely noted in energy storage primers (Convergent, EPA).
Scenario C: “You want zero surprises” (budget predictability)
Some CFOs prioritize predictability over maximum upside.
If you contract a storage service (e.g., storage PPA / shared-savings), the model may include:
- fixed monthly payment,
- performance conditions tied to peak reduction,
- optional variable component based on throughput.
Such structured storage PPA models are discussed in industry finance explainers (Synertics).
Visual #3: Data-to-decision mapping (what each dataset unlocks)
| Data you provide | What it tells us | What decision it supports |
|---|---|---|
| 15-minute load profile (12 months) | True peaks and their duration | Battery kW and kWh for peak shaving |
| Contracted power + tariff clauses | How demand charges are calculated | What contracted power reduction is “safe” |
| Price data (ToU/dynamic) | Arbitrage opportunity | Control strategy and additional savings |
| PV production profile | Surplus timing | Charge strategy and self-consumption |
| Single-line diagram / switchgear info | Integration feasibility | Project scope and timeline |
ROI and savings: the CFO view
For transactional decision-making, it helps to separate the savings streams and the risk factors.
1) Savings streams (where money is actually saved)
-
Lower contracted capacity / fixed charges
Direct reduction in fixed components tied to contracted power (your tariff determines the exact mechanism). -
Lower peak demand charges
By reducing the highest measured interval(s). This is often the biggest driver for C&I sites with demand charges (CESA). -
Energy arbitrage (optional upside)
Depends on price volatility and operational freedom (Convergent). -
Grid services / reliability (market- and contract-dependent)
Some sites monetize flexibility, and many value backup capability even if it’s not directly monetized (general BESS functions are outlined in BESS guides like Edina).
2) What can reduce savings (common pitfalls)
- Incorrect interval assumptions (15-min vs 60-min demand calculation)
- Not enough battery power (kW) to cap import during fast peaks
- Not enough usable energy (kWh) to sustain the cap long enough
- Efficiency losses (RTE) not included in arbitrage calculations (Edina)
- Operational exceptions: maintenance days, unusual production spikes, seasonal shifts
3) Why “smart control” matters
Peak shaving is simple in theory, but real facilities are messy:
- peaks move,
- operations change,
- PV output is weather-dependent,
- energy prices vary.
This is where AI scheduling helps: forecasting load and planning charge/discharge ahead of time increases the chance you hit the contracted power reduction target while still capturing extra value.
Why AIESS? (practical advantage, not extra work)
AIESS energy storage systems stand out with:
- AI Control - automatic charge/discharge scheduling
- Forecasts - energy prices, weather, load predictions
- 24/7 Monitoring - savings reports and continuous optimization
How to get started (without a long internal project)
A fast, low-friction approach usually looks like this:
-
Collect the right data (1–3 days)
- interval load profile (best),
- tariff + invoices,
- contracted power and penalties/clauses.
-
Run a baseline peak analysis
- how often you exceed your target,
- peak duration distribution (important for kWh sizing).
-
Model a few contracted power reduction targets
- “safe” (minimal risk),
- “balanced”,
- “aggressive” (max savings, higher risk).
-
Validate feasibility with site electrical constraints
- connection point, transformer, switchgear, protection.
-
Choose delivery model
- buy (CapEx) or contract (service/PPA/shared savings) depending on risk appetite and accounting preferences (Utility Dive, Synertics).
If you want a quick first-pass scenario before involving engineering teams:
Calculate power reduction scenario: kalkulator.aiess.pl
FAQ (Frequently Asked Questions)
-
What’s the difference between contracted power reduction and peak shaving?
Peak shaving is the operational method (battery discharges during peaks). Contracted power reduction is the commercial result: you can safely lower the contracted capacity and reduce fixed costs. -
How much data do we need to assess demand charges and contracted power?
Ideally 12 months of 15-minute (or hourly) interval data plus tariffs/invoices. At minimum, you need recent invoices and any available interval metering exports. -
Will an ESS always reduce our demand charges?
Not always. It works best when peaks are frequent, measurable, and short-to-medium duration. If your “peak” lasts many hours every day, you may need a larger (higher kWh) system, and ROI depends more on tariffs and price spreads. -
Does round-trip efficiency materially affect savings?
Yes—especially for arbitrage. RTE determines how much of the charged energy you can use later and should be included in the model (Edina). -
Can we reduce contracted power without changing production schedules?
Often yes. That’s the point of using an ESS: it covers short spikes so operations don’t have to. However, you must define “non-negotiable loads” so the import cap never risks downtime. -
Do DSOs allow batteries to operate behind-the-meter without special approval?
Requirements vary by region and connection arrangement. Many projects require interconnection review, protection settings, and commissioning steps. Make sure responsibilities are clear in the project contract (Morgan Lewis). -
Is it better to buy the battery or contract it as a service?
Buying can maximize long-term upside but requires capital and in-house capability. Contract models can be capital-light, shifting performance/operational risk to the provider (Utility Dive, Synertics). -
What if our peaks change over time?
They often do. That’s why continuous monitoring and adaptive control matter—so the system keeps meeting contracted power reduction targets even as operations evolve.
Summary
Contracted power reduction is a highly actionable way to cut fixed energy costs and demand charges, especially for commercial and industrial sites with short, expensive peaks. An ESS achieves this through peak shaving (capping grid import) and can optionally stack additional value via energy arbitrage—while accounting for real-world constraints like round-trip efficiency and DSO interconnection requirements (CESA, Edina, Morgan Lewis).
If you’re a CFO or facility manager, the fastest path to a decision is simple: get interval data, map your peaks, model a few targets, and validate feasibility with your connection constraints.
Next steps
-
Estimate your contracted power reduction scenario (quick, practical first pass):
Calculate power reduction scenario → -
Review AIESS implementation options (easy-to-use, easy-to-implement, 100% automatic):
View our offer → -
Read next (related AIESS articles):
Sources and References
Article based on data from:
- California Energy Storage Alliance (CESA). “Energy Storage Program Design for Peak Demand Reduction” (PDF).
https://www.cesa.org/wp-content/uploads/Energy-Storage-Program-Design-for-Peak-Demand-Reduction.pdf - Morgan Lewis (2023). “Key Considerations for Utility-Scale Energy Storage Procurements.”
https://www.morganlewis.com/pubs/2023/03/key-considerations-for-utility-scale-energy-storage-procurements - Synertics (2024). “Understanding Storage PPAs.”
https://synertics.io/blog/131/understanding-storage-ppas - Edina. “Battery Energy Storage System (BESS) | The Ultimate Guide.”
https://www.edina.eu/power/battery-energy-storage-system-bess - Utility Dive (2022). “Energy storage for utilities: Is it better to own or contract a battery…”
https://www.utilitydive.com/spons/energy-storage-for-utilities-is-it-better-to-own-or-contract-a-battery-sto/621374/ - US EPA. “Electricity Storage.”
https://www.epa.gov/energy/electricity-storage - Convergent Energy + Power. “Energy Storage 101: How Energy Storage Works.”
https://resources.convergentep.com/energy-storage-101-how-energy-storage-works
Last updated: January 22, 2026